Thursday, February 27, 2014

Rich Bernstein says "Buy Japan"

I have been meaning to get to this Rich Bernstein (formerly the chief strategist at Merrill Lynch and a guy with something of a following) piece for some time. It appeared on 2/17 in the FT and concludes that Japan is a good place to invest, especially in relation to the emerging markets:

His argument starts with this:

A global credit bubble was built.

Credit related assets are starting to deflate (emerging markets).

Malinvestment from the credit bubble is being revealed.

At this point, I had my hopes up as this all sounded pretty Austrian. From Bernstein:

Bubbles create capacity that is no longer needed when a bubble deflates, and the global credit bubble  was no exception. Tremendous productive capacity was built in many emerging markets under the assumption that growth in these economies would accelerate. Those forecasts proved incorrect, and overcapacity is indeed building as the credit bubble deflates.

Unfortunately, it goes downhill from here. He highlights the idea that this malinvestment is driving global productivity down and that the primary method for gaining market share without productivity growth is currency depreciation.

In the emerging markets he says that currency depreciation isn't an option as inflation is building in those markets. However, Japan is crashing the yen. This gives Japan a wonderful opportunity to gain market share and grow.

Ergo, Japan is a wonderful place to invest.

He comes so close to grasping the idea that debasement and unbacked credit growth create malinvestment, yet throws the concept completely overboard when discussing Japan. This Austrian would summarize the article this way:

Yes, easy money created malinvestment in emerging markets following the credit induced boom. Japan is just entering this malinvestment stage, be sure to get on board.

Even with the scope of the malinvestments that we saw revealed in 2000 and 2008 and that we are starting to see come to light once again, it sometimes feels completely hopeless that analysts will ever understand ABCT and how we destroyed our society.

 Disclaimer: Nothing on this site should be construed as investment advice. It is all merely the opinion of the author.
Wednesday, February 19, 2014

Goldman Sachs and the Clustering of Errors

The January 16, 2014 issue of Fortune contained a nice article on what a great place Goldman Sachs is to work. The article focused on the combination of highly intelligent, motivated workers selflessly toiling away in an atmosphere driven by collegiality and teamwork. It is a culture where the best and brightest in our society work together for the betterment of team Goldman, a culture that seems to be different than the "eat what you kill" culture that defines other investment banks.

I have known a number of Goldmanites over the years and I would say that the above is true. The article also spent some time discussing how this culture, or operating system as Lloyd Blankfein described it, was what allowed the firm to bounce back so well from the financial crisis.

No, they don't mention the the largess of the U.S. Treasury pouring more than $100 billion of taxpayer capital into Goldman and the other bankrupt banking entities of the day. Nor do they mention the trillions of dollars that the Fed pumped into the banks, buying and revaluing up their failing assets. No mention is given of the bailout of AIG either, which was the crumbling keystone that was going to bring down the stupidly leveraged financial system. No, it was their culture that saved them.

Sure.

I digress, however. The more interesting question is, just how did the smartest, hardest working, team oriented people on this planet push themselves to the very edge of bankruptcy?

This is a question that is not asked often enough, and I don't just mean regarding Goldman Sachs. In Austrian Business Cycle Theory (ABCT) this problem of how smart entrepreneurs and capitalists all wind up making the same mistake at the same time is referred to as the "clustering of errors" problem.

The game of capitalism rewards those entrepreneurs and capitalists who make the best forecasts. These people will be rewarded with profits. The market then is a "breeding ground," in the words of Murray Rothbard, "for the reward and expansion of successful, far-sighted entrepreneurs and the weeding out of inefficient businessmen. As a rule only some businessmen suffer losses at any one time; the bulk either break even or earn profits? How then, do we explain the curious phenomenon of the crisis when almost all entrepreneurs suffer sudden losses? In short, how did all of the country's astute businessmen come to make such errors together, and why were they all suddenly revealed at this particular time? This is the great problem of cycle theory."

Rothbard, in his book "America's Great Depression" quotes economist Siegfried Budge, "In the purely free and unhampered market, there will be no cluster of errors, since trained entrepreneurs will not all make errors at the same time." This is an important and insightful statement.


Well then, how do we get the best and brightest to all blow their capital allocation decisions at the same time? ABCT lays particularly heavy blame at the feet of central banks who intervene in the interest rate market, generally to artificially lower interest rates.

If a society has a time preference that lengthens, they will consume less today and choose to save more. This saved capital can then be lent out, increasing the supply of real capital in the system. This increase in the supply of real capital should serve to lower interest rates. This lowering of rates and the increase of real capital should serve to lengthen the structure of production. It sends a signal to entrepreneurs that they can engage in an increase in investment, particularly those investments with a longer time horizon. That is, projects farther away from the end consumer, those whose output take lots of time to reach the consumer, are likely to be the biggest beneficiaries of such a change in time preference.

Central banks, in their zeal to increase economic activity (kindle animal spirits for you Keynesians) often choose to print money from thin air and artificially reduce interest rates. The signal that this sends to capitalists and entrepreneurs is that there has been an increase in real savings, or capital, in the system. Projects that may take some time to come to fruition now look like a better bet to entrepreneurs than they did when interest rates were higher and new investments are made. The problem is, not only has there not been an increase in the amount of real savings in the system, but the artificially low rates have actually reduced the amount of savings that society is willing to provide. An imbalance between the supply and demand for real capital has been created. Entrepreneurs and capitalists have been fooled by the false signals fed into the market by central bank intervention. As this becomes apparent at some point in the future, a recession occurs as the wasted capital is written off.

This is how even our best and brightest at Goldman Sachs have been fooled and have pushed themselves to the edge of bankruptcy. The Fed, the European Central Bank, the Bank of Japan, the People's Bank of China and all the rest of the central banks continue to send false signals to the system, creating huge imbalances, crushing the supply of savings and real capital with artificially low rates, all the while creating increased demand for real capital. It is a complete mess. Goldman Sachs has only tinkered with their capital structure and they remain a highly leveraged institution in an age of massive malinvestment. They will revisit the edge of bankruptcy again.

 Disclaimer: Nothing on this site should be construed as investment advice. It is all merely the opinion of the author.


Monday, February 17, 2014

Asset Values as Claims on Goods and Services (Part II)

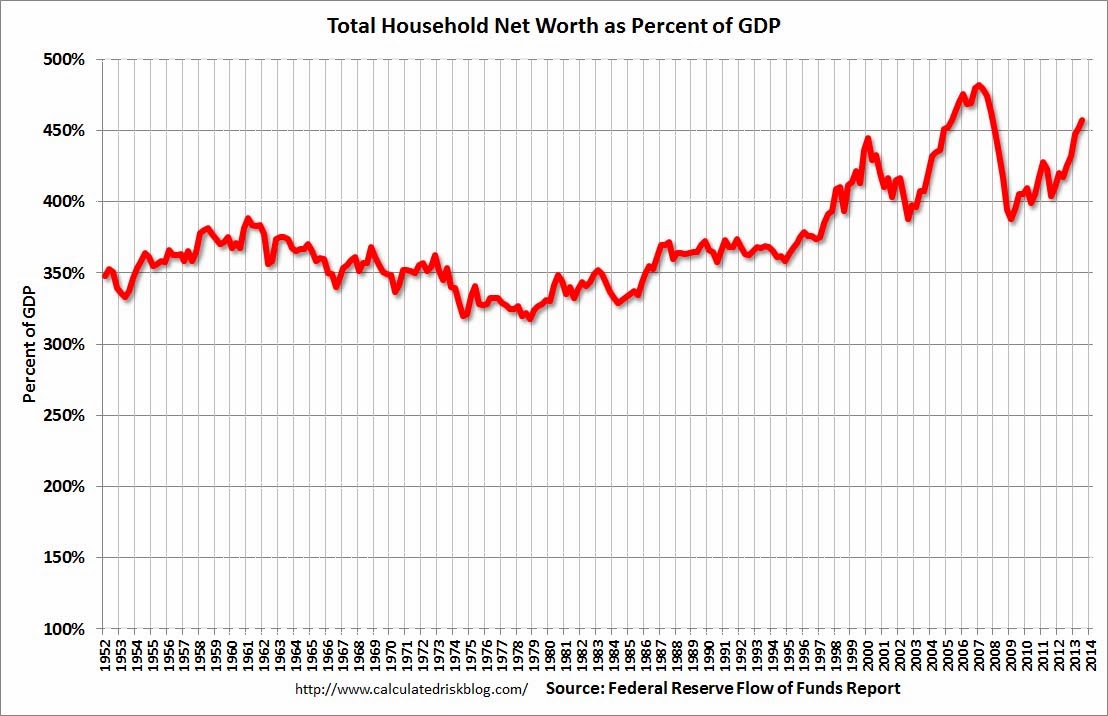
In the 1980s and 1990s the savings rate fell to 5% while real GDP growth averaged close to 3% for the two decades. A society that generates that type of savings rate and real growth should see HHNW/GDP level out at around 270%. A curious thing happened however, as HHNW shot up towards 440% of GDP at the end of 1999.

Artificially low interest rates create an imbalance between the value of assets in the system and the amount of real goods and services that are available to back them up. Artificially low rates crush the incentive to save, the primary driver of wealth creation over time, while the money and credit created from thin air by the Fed and the financial system creates new claims on goods and services which can also drive up existing asset values.

By the end of the 1990s it is clear in hindsight that a bubble had developed in asset values relative to the size of the economy and the savings rate engendered by low interest rates. We have crashed the system twice since then, with the Fed responding more forcefully each time with money creation from thin air. This is doing nothing to rationalize the imbalances in the system. It is actually further destroying the incentive to save, which is pushing down the secular growth rate in real GDP while driving asset values to absurd levels.

For the past decade real GDPgrowth has been a bit less than 2% while the savings rate has plunged towards 1% of GDP. These types of numbers should generate HHNW/GDP of around 150% over time. My guess is that when we see the HHNW/GDP number released in March it will have come close to the all-time high valuation of 2007 at around 470%. We have the lowest growth rate in real GDP since the period from 1930-40, the lowest savings rate since that time too and we have the highest valuation levels ever. Does this make sense?

The bottom line is that this is the biggest asset bubble ever. One of the great insights of Austrian economics is that assets that aren't backed up by savings and output are the definition of malinvestment. It would be wise for investors to remember this.

 Disclaimer: Nothing on this site should be construed as investment advice. It is all merely the opinion of the author.


Wednesday, February 5, 2014

Asset Values as Claims on Goods and Services

CR 12-9-13 FFQ3Net

This graph represents the household net worth of the U.S. as a percent of GDP at the end of Q3 2013. I have been fascinated by this graph since I first saw it at the end of 1999, and I am going dissect it in a couple of parts in the next few posts.

As a skeptic of technology shares and the value of the equity market in 1999, I spent quite a bit of time thinking about this graph.The first thing that jumps out at you is the long period of time that the valuation of HHNW/GDP spent in the 350% range. The first time I saw someone use this valuation metric he was trying to say (in 1999) that HHNW was 100% above its long term average and that he thought asset values could fall by $10 trillion, which was the GDP figure at the time.

As someone who was bearish, the idea of accepting that conclusion and moving on was tempting, but I wanted to know why 350% had been, for so long, where HHNW/GDP had settled. Perhaps 350% was too low. Maybe 450% was too low. The analyst using the graph as something to back up his own bearish bias was just assuming that the past numbers were correct, but were they?

Let's apply a little a priori logic here and try and work backwards.What is it that drives real wealth in a society? How does HHNW increase? The answer is pretty simple, savings plus real increases in output are what allow a society to increase its wealth. So, we can express the numerator of the quotient as:

(Savings Rate + Real GDP Growth Rate)

The final step would be to divide this sum by the real GDP growth rate to come up with the rough calculation for where HHNW/GDP would max out over time.

In looking at the data for the 1950s and 1960s, the savings rate was approximately 10% of GDP and real GDP growth averaged nearly 4% over the two decades. Using the above formula we see that:

(.10+.04)/.04 = 3.5

There seems to be some logic behind the 350% number.

In the 1970s, the savings rate started to fall post the abandonment of Bretton-Woods and the tying of the dollar to gold (a topic for another time) as did the real growth rate. The savings rate averaged about 8% and real growth fell closer to 3%. These numbers would see HHNW/GDP grow to a theoretical maximum of 367% over time. So far so good.

Looked at another way, what this tells us is that through the 1970s, increases in HHNW over time were backed up by incremental real output and real savings. There were real goods and services backing up the assets used in calculating HHNW. This is as it should be since assets like stocks, bonds, home equity and bank deposits represent a potential claim on other goods and services.

This all began to change in the 1980s, and not in a good way.


This 


The Fed estimated that the value of household real estate increa
Read more at http://www.calculatedriskblog.com/2013/12/feds-q3-flow-of-funds-household.html#klW6ZX723hwOQziX.99
The Fed estimated that the value of household real estate increa
Read more at http://www.calculatedriskblog.com/2013/12/feds-q3-flow-of-funds-household.html#klW6ZX723hwOQziX.99


Household Net Worth as Percent of GDP Click on graph for larger image.

This is the Households and Nonprofit net worth as a percent of GDP.  Although household net worth is at a record high, as a percent of GDP it is still below the peaks in 2000 (stock bubble) and 2006 (housing bubble).

This includes real estate and financial assets (stocks, bonds, pension reserves, deposits, etc) net
Read more at http://www.calculatedriskblog.com/2013/12/feds-q3-flow-of-funds-household.html#klW6ZX723hwOQziX

Tuesday, February 4, 2014

Could the "Exorbitant Privilege" Come Home to Roost?

In the 1960's, French Finance Minister Valerie Giscard d"Estaing complained of the "exorbitant privilege" that had been been extended to the United States as the sole issuer of dollars, seen at the time as the equivalent of gold for reserve purposes and as the currency for international trade. This privilege allowed the U.S. to issue virtually unlimited amounts of paper and to export inflation overseas.

Under the Bretton-Woods monetary system of the time, the U.S. still had to honor its commitment to exchange its gold at $35/ounce to foreigners, however. Unlimited paper issuance by the U.S. forced a default on this obligation in 1968. Unfortunately, the world then adopted the fiat dollar as the world's reserve currency, exacerbating the "exorbitant privilege."

Over the decades, the U.S. has certainly enjoyed its status as the issuer of the reserve currency of the world. As of Q3 2013, the IMF's COFER report shows that foreign exchange reserves (held largely by central banks) amounted to $11.4 trillion U.S. dollar equivalents (up 6.7x since Q3 1999), with approximately 60% held in dollars. Let's call that $6.8 trillion issued by the U.S. and held overseas.

About half of that total ($3.3 trillion) is held by the Fed itself. That is, foreign central banks may recycle the dollars that they generate via their current account surplus into securities held at the Fed. Here is a graph of that activity over the recent years:

 
Weekly, As of Wednesday, Not Seasonally Adjusted, Updated: 2014-01-30 3:53 PM CST

It is easy to see that foreigners were not keen dollar sellers in 2008/9 crisis, though their accumulation did stop towards the end of 2008 as global trade slowed dramatically. Periods of emerging market weakness have been somewhat different since then, with foreigners becoming net dollar sellers in the second half of 2011, the middle of 2013, and again very recently.

If this is a sign that the age of America's "exorbitant privilege" is ending, there is also then potential for a significant rise in CPI type inflation if overseas demand falls and these dollars return home.

 Disclaimer: Nothing on this site should be construed as investment advice. It is all merely the opinion of the author.